HPLC Purity, Explained: What “99% Pure” Really Tells You
Almost every peptide certificate of analysis leads with one number. Here is what HPLC purity actually measures, what a proper method looks like, and why two vials can both read 99.1% while one of them is really closer to 91%.
Subscribe to free Peptide 101
Enter your email to be alerted when new articles are posted. It’s free, and no more than a few emails a month.
The short version
- HPLC purity is a ratio of peak areas, not an amount and not proof of identity.
- The number depends on the method as much as on the sample. A fast method can fold impurities into the main peak and count them as product.
- It only covers peptide-related impurities. Water, salts, solvents, metals and endotoxin need their own tests.
What HPLC purity measures
High-performance liquid chromatography (HPLC) pushes a dissolved sample through a packed column. For peptides this is almost always reversed-phase HPLC on a C18 column, which separates molecules by how hydrophobic they are. As each species comes off the column, a UV detector, usually set at 210–220 nm where the peptide bond absorbs, draws a peak. Software then measures the area under every peak.
Purity is simply:
Two things follow from that definition. First, purity is relative: it tells you what share of the detected material sits in the main peak. Second, it depends entirely on what the method managed to separate and what the analyst chose to integrate. Anything hiding inside the main peak is counted as product.
What it’s good for
Done properly, HPLC is the best single window into how cleanly a peptide was made. Peptides are built one amino acid at a time, and each step leaves a fingerprint when it goes slightly wrong:
| Impurity HPLC can reveal | Where it comes from |
|---|---|
| Deletion and truncated sequences | A coupling step that didn’t go to completion |
| Incompletely deprotected peptide | A protecting group left on after cleavage |
| Oxidized forms | Methionine or tryptophan exposed to air, light or peroxides |
| Deamidated forms | Asparagine or glutamine degrading over time, faster in solution |
| Dimers and aggregates | Peptide chains associating during storage |
A good method pulls each of these into its own peak so it can be measured. That is what lets a manufacturer compare one lot to the last ten, and watch a lot age on a stability program to see exactly which degradant is growing.
What a proper method looks like
Peptides and their impurities can differ by a single amino acid or one oxidized residue, so they come off the column very close together. Whether you can see them depends on how the method is built.
| Parameter | Proper method | Red flag |
|---|---|---|
| Gradient | Shallow, roughly 0.5–1% organic per minute through the peptide’s elution window | 5→95% in 10 minutes |
| Run time | Long enough for late impurities to elute, followed by a column wash | Ends right after the main peak |
| Column | C18, 150–250 mm, temperature controlled, stated on the report | Not stated |
| Detection | 210–220 nm | 254 nm, or not stated |
| Blank | Blank injection run alongside to show system peaks | No blank |
| Validation | Specificity shown by forced degradation; quantitation limit around 0.05% | “In-house method,” no details |
| Integration | Every peak above a stated reporting threshold, consistent baseline | Thresholds set high enough to drop small peaks |
What “validated” means here: a validated purity method has been shown to separate the peptide from its likely impurities. The key test is forced degradation: the peptide is deliberately stressed with heat, acid, base, oxidation and light, and every degradant must separate from the main peak. Validation follows ICH Q2(R2).3
Two methods, same 99.1%
Most certificates show the chromatogram at full scale. At that scale every trace looks clean, because the main peak fills the frame and a half-percent impurity is a bump only a few pixels tall.
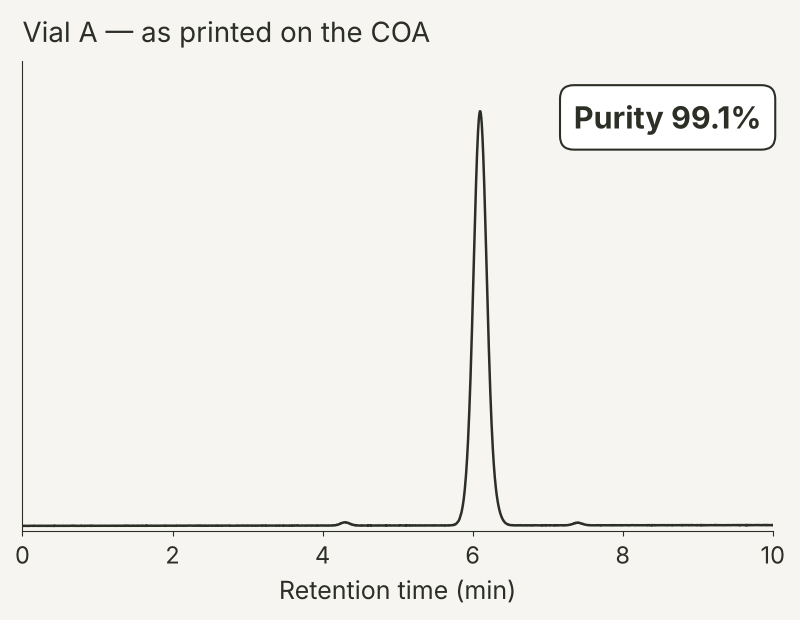
Impurities are judged on a baseline zoom, where the vertical axis is scaled down so the small peaks are visible. Here are two vials, both reported at 99.1%, zoomed to the baseline.
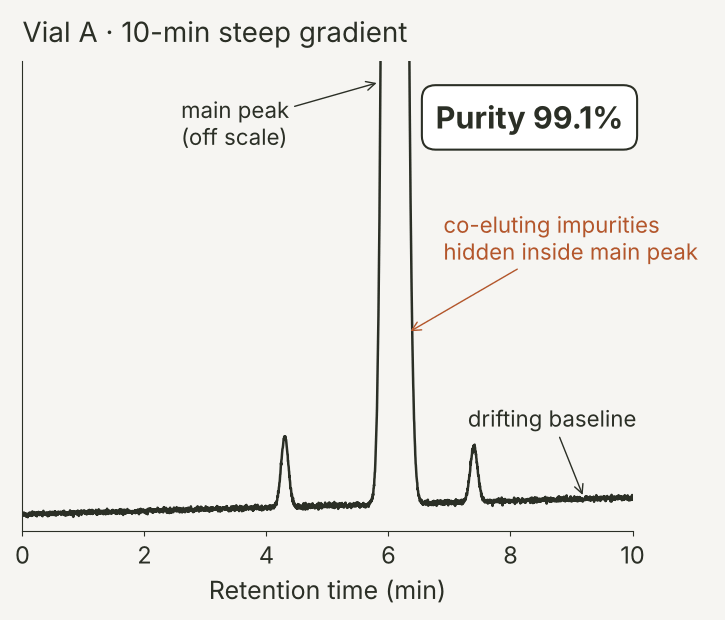
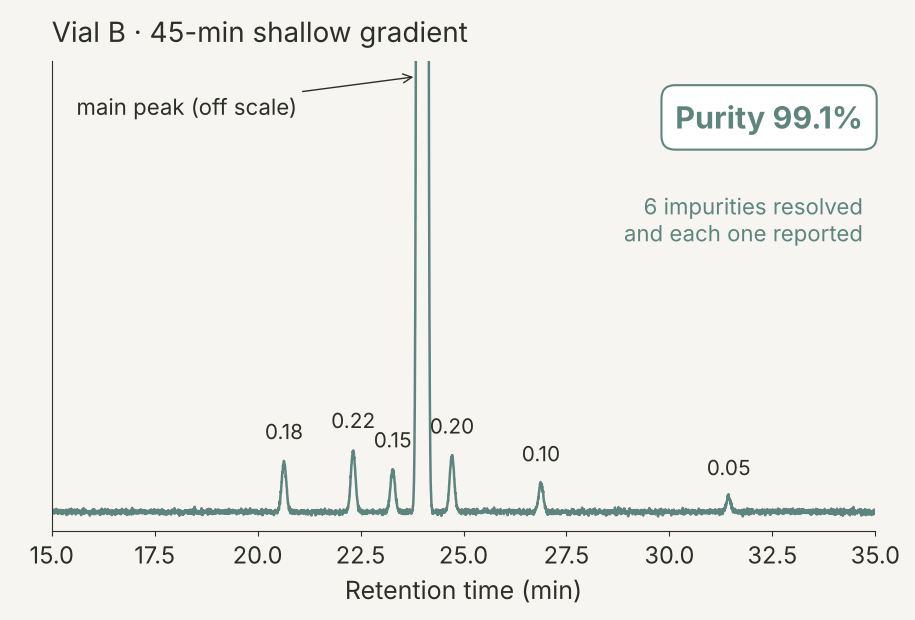
Vial A was run on a ten-minute gradient from 5% to 95% organic. Everything is crowded into a few minutes, the main peak is broad at the base, and the baseline drifts. Vial B was run on a 45-minute shallow gradient. Its main peak is sharp, and six small impurities are pulled out on either side of it, each one measured. They add up to 0.9%, so its 99.1% is earned.
Same number on both certificates. The number alone can’t tell you which one to trust.
Look beneath the peak
Here is what Vial A’s fast method was hiding. Zoom into the base of its main peak and two impurities, one eluting just before the peptide and one just after, sit inside the peak’s envelope. The software draws a single peak from start to finish and counts all of that area as product.
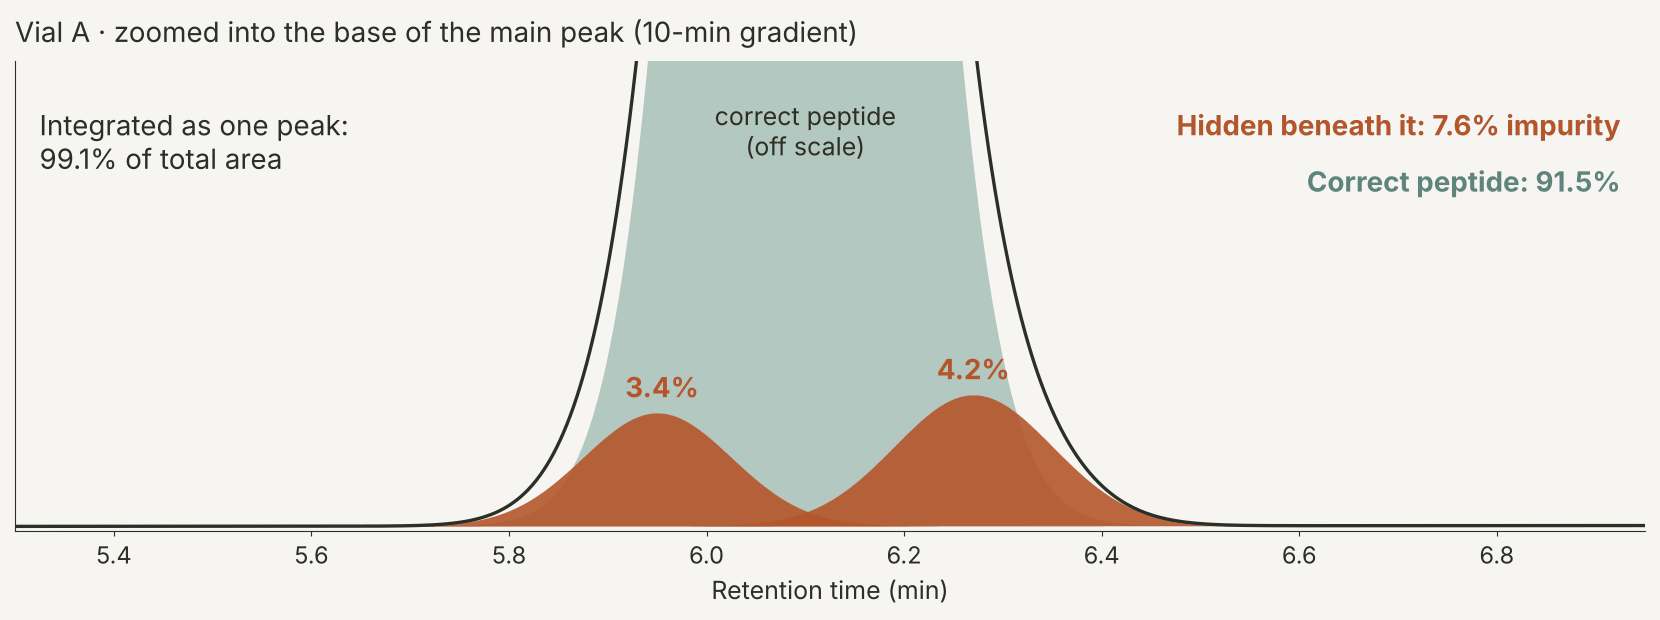
Re-run the same vial on the 45-minute method and those impurities separate into their own peaks.
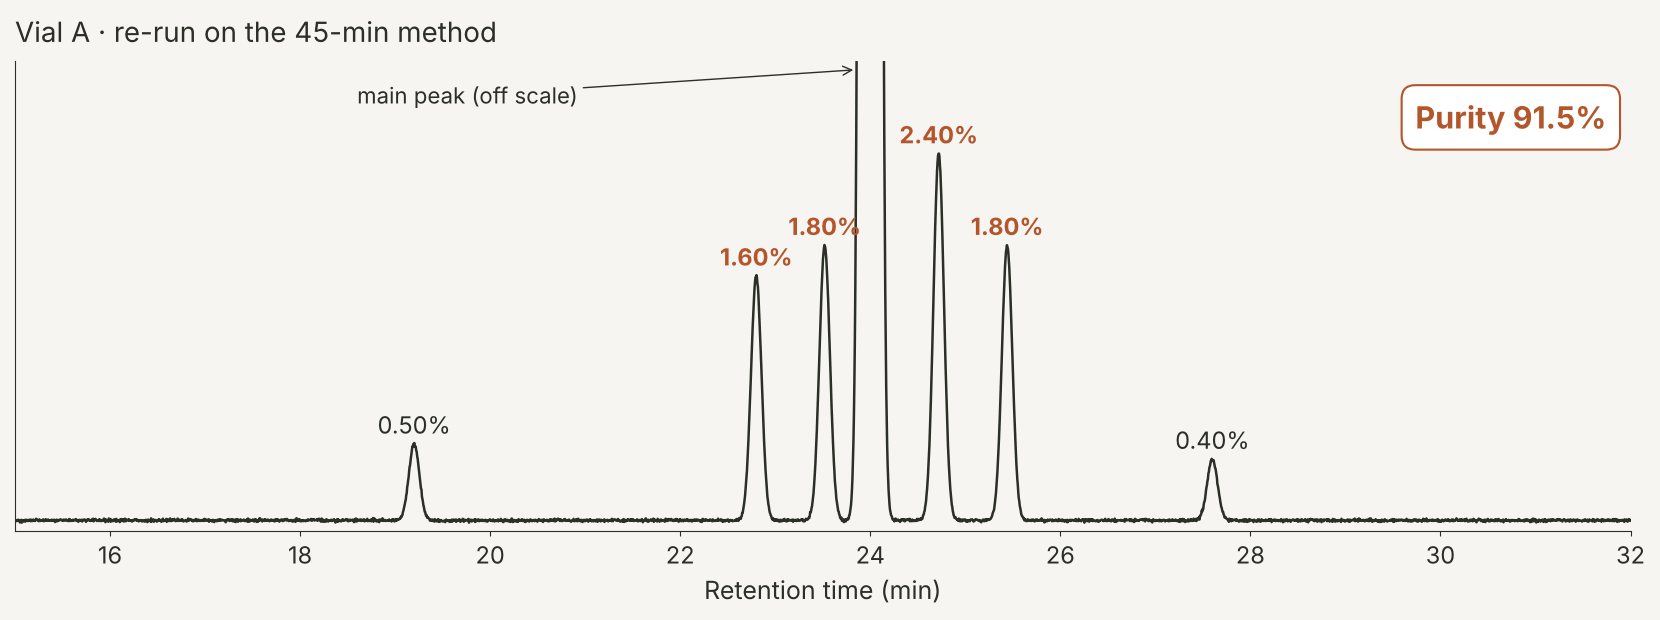
Nothing about the vial changed. The impurities were always there; the fast method just couldn’t separate them. This is the pattern behind many gray-market purity claims: a short, steep gradient doesn’t remove impurities, it hides them under the main peak where they are counted as product.
Why the individual peaks matter: each of Vial A’s four larger impurities is several times higher than 0.5%, the ceiling FDA applies to any new peptide-related impurity in a generic synthetic peptide.1 An impurity at that level can change how the immune system responds to a peptide. On a pharmaceutical specification, this lot would fail.
What HPLC purity can’t tell you
Even a perfect purity method answers only one question: of the peptide material that is here, how much is the right one?
It can
- Separate and rank peptide-related impurities
- Track a lot across its shelf life
- Compare lots run on the same validated method
It can’t tell you
- Identity, which takes mass spectrometry
- How much peptide is in the vial (peptide content)
- Anything without UV absorbance: water, salts, counter-ions, metals, solvents
- Impurities that co-elute even on a good method, like some D-isomers
- Endotoxin or sterility
- Anything that never eluted from the column
A purity result is one test. A real certificate of analysis is a panel of tests. Our side-by-side COA comparison shows what each documentation tier actually covers.
Why GMP suppliers don’t advertise “99%”
You won’t find “99% pure” as a headline on a pharmaceutical certificate of analysis. GMP manufacturers don’t claim a purity. They set a specification in advance, with individual limits for identity, assay, each named impurity, total impurities, water, counter-ion, residual solvents and endotoxin, and every lot must meet it before it ships. The result is reported as “conforms.”
That approach reflects how regulators look at peptide quality: one impurity at a time. In its 2021 guidance for generic synthetic peptides, FDA recommends that every peptide-related impurity at 0.10% or more be identified, and that any new impurity not exceed 0.5% and be characterized and justified.1 A single total can’t show that, because 99.1% can mean ten tiny impurities or one large one.
True 99% purity is also extremely hard to achieve for a synthetic peptide. It takes careful synthesis, repeated purification and real yield loss. That difficulty is one of the main reasons inadequate methods get used: a short, steep gradient folds impurities into the main peak and gives the appearance of higher purity than the material really has.
And even an honest purity number only covers peptide-related impurities. It says nothing about water, salts and TFA counter-ion, residual solvents, heavy metals, endotoxin or sterility. A “99% pure” label leaves every one of those unaddressed.
What independent testing found
A 2026 analysis of independent testing data covered 6,285 samples from 203 vendors across 14 peptides sold directly to consumers.2
Keep in mind: the samples were voluntarily submitted, so they aren’t a random sample of the market, and the study is a preprint that hasn’t been peer reviewed. The authors describe the failure rates as a lower bound, because only a few quality attributes were tested. Purity in that dataset was also measured the way most COAs measure it, as an area percentage on each testing lab’s own method, so as this article shows, it depends on the method.
What to ask for
Instead of a headline number, ask for the whole picture:
- The full chromatogram, zoomed to baseline
- An impurity table listing each peak’s relative retention time and area %
- The method: column, gradient, run time and detection wavelength
- Mass spectrometry confirming identity
- Peptide content or assay, so you know how much peptide is actually there
- Endotoxin results, plus sterility for anything injectable
- The manufacturer’s name and site address
- A lot number that matches your vial
If a seller can’t produce these, the purity number on the label isn’t telling you much.
Know what’s in your vial
Every AJ Peptide prescription is compounded by a named, licensed U.S. 503A pharmacy and provided in solution, ready to use. The certificate of analysis is available on request, and the provider evaluation is free of charge.
See all current peptide therapiesPrescription required. Treatment is prescribed only if a licensed provider determines it is appropriate for you.
Subscribe to free Peptide 101
Be alerted when new articles are posted: plain-English peptide chemistry, testing standards and clinical evidence. No more than a few emails a month.
References
- U.S. Food and Drug Administration. ANDAs for Certain Highly Purified Synthetic Peptide Drug Products That Refer to Listed Drugs of rDNA Origin: Guidance for Industry. May 2021.
- Mendias CL, Awan TM. Evaluation of research grade peptides marketed directly to consumers reveals extensive variability in purity and measured abundance. Preprints.org 2026. doi:10.20944/preprints202604.1748.v1 (preprint, not peer reviewed).
- International Council for Harmonisation. ICH Q2(R2): Validation of Analytical Procedures. 2023.
 AJ Peptide is LegitScript certified.